> ## Documentation Index
> Fetch the complete documentation index at: https://docs.insforge.dev/llms.txt
> Use this file to discover all available pages before exploring further.
# 分析
> 由 PostHog 驅動的應用產品分析。
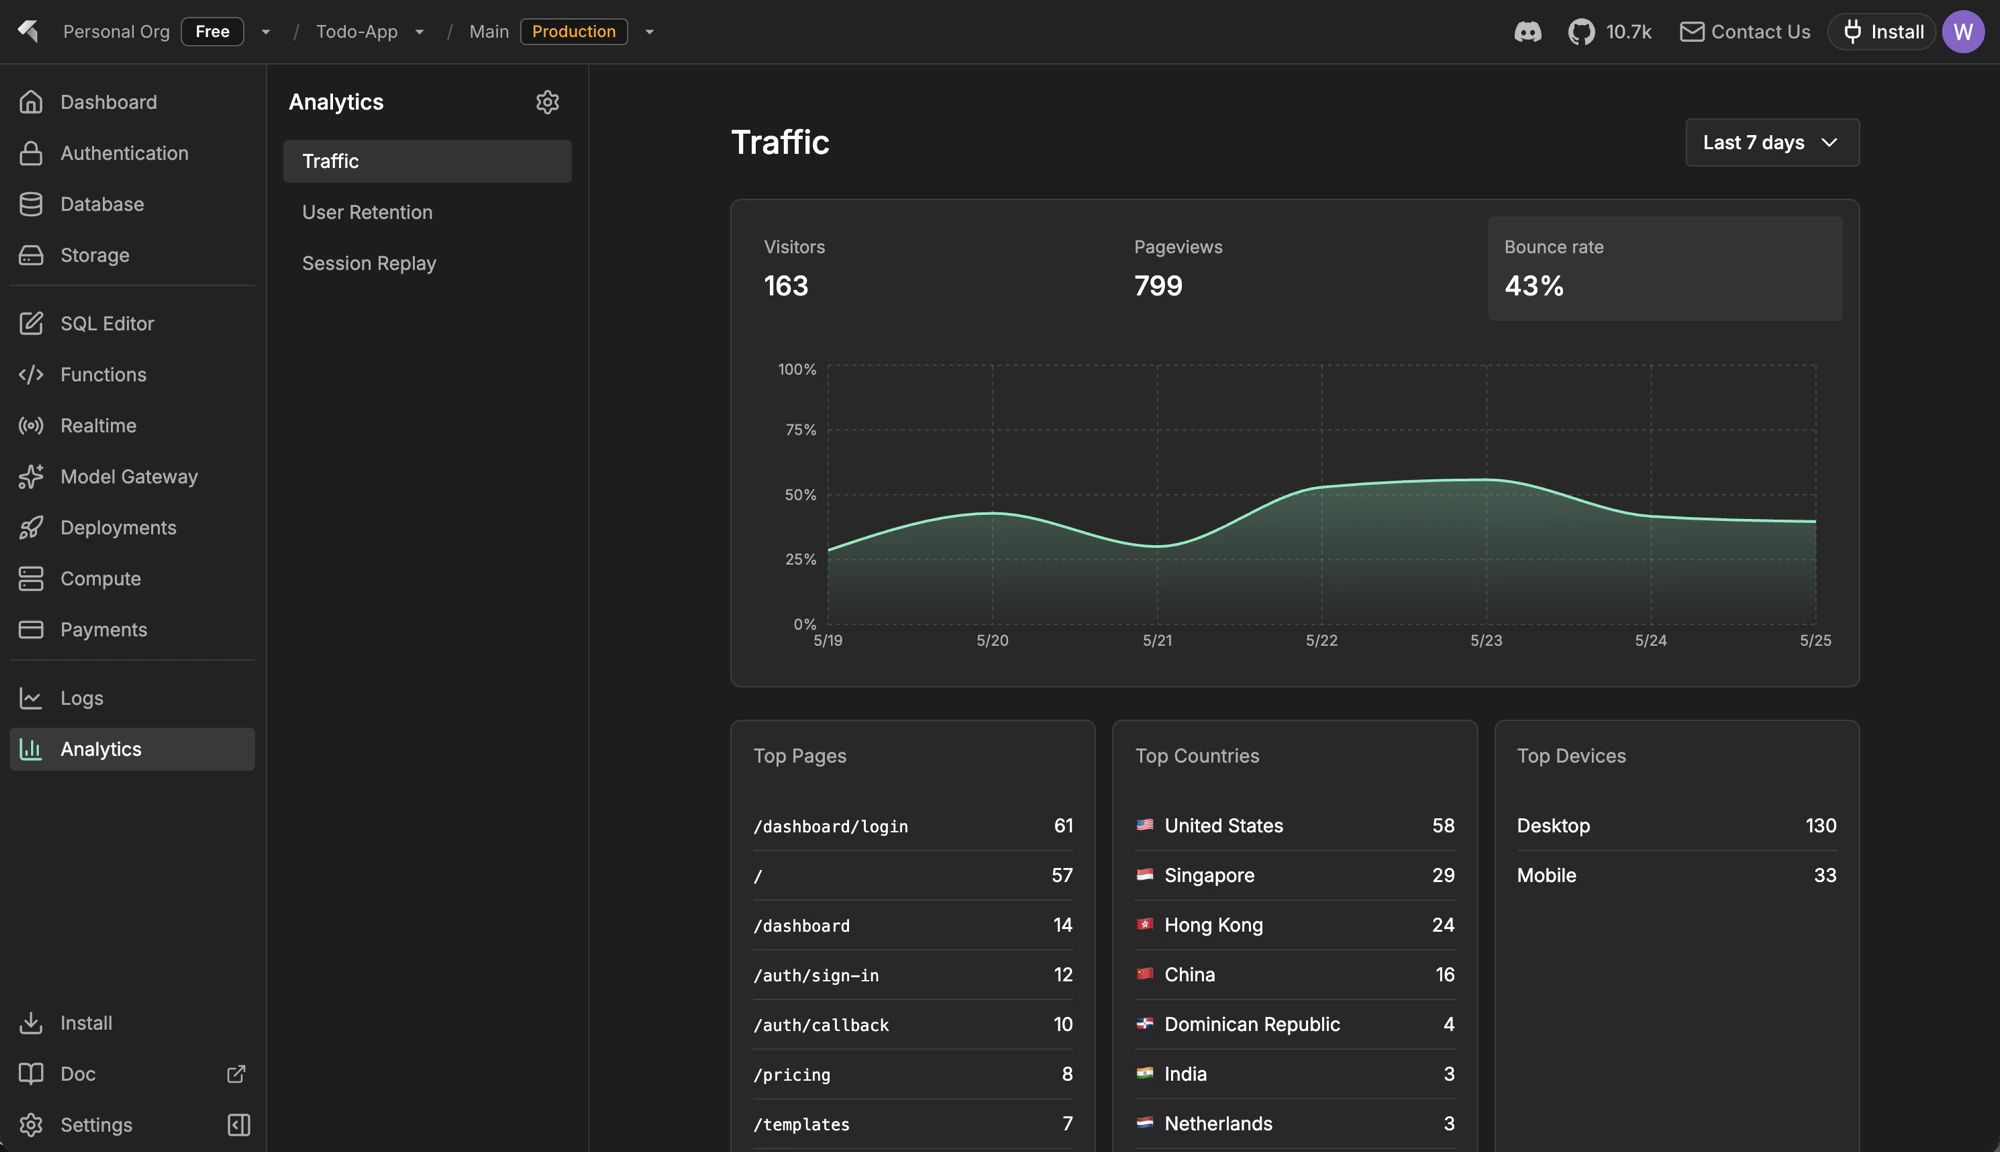
使用 InsForge 分析來瞭解人們如何實際使用您的應用程式:頁面流量、保留和工作階段回放,所有這些都透過將 PostHog 專案連接到您的 InsForge 後端來進行。連接後,儀表板在您的 PostHog 資料上呈現流量、使用者保留和工作階段回放頁面,無需離開 InsForge。
只需點擊一次連接 PostHog,將設定提示放入您的編碼代理中,以便它執行 PostHog 嚮導並在您的前端安裝 PostHog SDK,然後分析頁面開始填充。
 PostHog 仍然是事件、儀表板、見解和錄製的真實來源。InsForge 為日常檢查呈現一個集中的子集,然後對於超出其範圍的任何內容都深入連結到 PostHog。
```mermaid theme={null}
flowchart TB
Admin["Dashboard"] --> AnalyticsAPI["Analytics API"]
App["Frontend App"] --> SDK["PostHog SDK"]
SDK --> PostHog["PostHog"]
AnalyticsAPI --> PostHog
PostHog --> Traffic["Traffic / KPIs"]
PostHog --> Retention["User Retention"]
PostHog --> Replay["Session Replay"]
Traffic --> Pages["Analytics pages"]
Retention --> Pages
Replay --> Pages
style Admin fill:#1e293b,stroke:#475569,color:#e2e8f0
style App fill:#1e293b,stroke:#475569,color:#e2e8f0
style SDK fill:#1e40af,stroke:#3b82f6,color:#dbeafe
style AnalyticsAPI fill:#166534,stroke:#22c55e,color:#dcfce7
style PostHog fill:#c2410c,stroke:#fb923c,color:#fed7aa
style Traffic fill:#0e7490,stroke:#06b6d4,color:#cffafe
style Retention fill:#0e7490,stroke:#06b6d4,color:#cffafe
style Replay fill:#0e7490,stroke:#06b6d4,color:#cffafe
style Pages fill:#6b21a8,stroke:#a855f7,color:#f3e8ff
```
## 功能
### 一鍵 PostHog 連接
從儀表板中的分析頁面連接 PostHog。InsForge 為您配置或連結 PostHog 專案,儲存認證到伺服器端,並在連接成功後解鎖流量、保留和工作階段回放頁面。
### 透過 PostHog 嚮導的 SDK 設定
連接後,空狀態會提示您一個設定提示,您可以將其貼到您的編碼代理中:
```
I want to add product analytics to this project. Read the current directory and use the InsForge skill to set up PostHog analytics by running `npx @insforge/cli posthog setup`.
```
`@insforge/cli posthog setup` 將您的 InsForge 專案連結到 PostHog,然後列印官方 [PostHog 嚮導](https://posthog.com/docs/libraries/wizard) 命令 (`npx -y @posthog/wizard@latest`) 供您(或您的代理)接下來執行。嚮導檢測您的框架,安裝正確的 PostHog SDK,並放入初始化程式碼,以便頁面瀏覽、自動擷取事件和工作階段錄製開始流動。
### 流量
您選定的時間範圍內的 KPI(訪客、頁面瀏覽、工作階段、跳出率和趨勢),加上按頁面、國家和裝置類型的細分。對於第一次"本週應用程式的表現如何"的檢查而無需打開 PostHog 很有用。
### 使用者保留
從您的 PostHog 事件建構的隊列保留圖表。選擇一個時間範圍,看看有多少使用者在隨後的幾天或幾週內回來。
### 工作階段回放
最近工作階段錄製的分頁清單,包含持續時間、個人和深入連結到 PostHog 的完整回放播放器。當在流量或保留中發現異常後,可幫助您觀察使用者實際做了什麼。
### 設定和中斷連接
分析設定對話(側邊欄中的齒輪圖示)讓管理員審查連結的 PostHog 專案,直接跳轉到 PostHog,並在需要時中斷連接。中斷連接只會中斷 InsForge ↔ PostHog 連結;您的 PostHog 專案、事件和錄製保持不變。
## 概念
分析頁面後面的事件、自動擷取、見解和儀表板。
錄製如何被擷取、編輯和回放。
## 使用它進行建置
自動檢測您的框架,安裝正確的 PostHog SDK,並新增初始化程式碼。
在嚮導設定的基礎上擷取自訂事件。
`npx @insforge/cli posthog setup` 將您的 InsForge 專案連結到 PostHog,然後列印嚮導命令。
## 下一步
* 在儀表板中開啟分析頁面,點擊 **連接 PostHog**。
* 將設定提示貼到您的編碼代理中,然後執行它列印的 `@posthog/wizard` 命令,將 SDK 連接到您的應用程式。
* 如果您想從終端管理連接,設定 [CLI](/quickstart)。
PostHog 仍然是事件、儀表板、見解和錄製的真實來源。InsForge 為日常檢查呈現一個集中的子集,然後對於超出其範圍的任何內容都深入連結到 PostHog。
```mermaid theme={null}
flowchart TB
Admin["Dashboard"] --> AnalyticsAPI["Analytics API"]
App["Frontend App"] --> SDK["PostHog SDK"]
SDK --> PostHog["PostHog"]
AnalyticsAPI --> PostHog
PostHog --> Traffic["Traffic / KPIs"]
PostHog --> Retention["User Retention"]
PostHog --> Replay["Session Replay"]
Traffic --> Pages["Analytics pages"]
Retention --> Pages
Replay --> Pages
style Admin fill:#1e293b,stroke:#475569,color:#e2e8f0
style App fill:#1e293b,stroke:#475569,color:#e2e8f0
style SDK fill:#1e40af,stroke:#3b82f6,color:#dbeafe
style AnalyticsAPI fill:#166534,stroke:#22c55e,color:#dcfce7
style PostHog fill:#c2410c,stroke:#fb923c,color:#fed7aa
style Traffic fill:#0e7490,stroke:#06b6d4,color:#cffafe
style Retention fill:#0e7490,stroke:#06b6d4,color:#cffafe
style Replay fill:#0e7490,stroke:#06b6d4,color:#cffafe
style Pages fill:#6b21a8,stroke:#a855f7,color:#f3e8ff
```
## 功能
### 一鍵 PostHog 連接
從儀表板中的分析頁面連接 PostHog。InsForge 為您配置或連結 PostHog 專案,儲存認證到伺服器端,並在連接成功後解鎖流量、保留和工作階段回放頁面。
### 透過 PostHog 嚮導的 SDK 設定
連接後,空狀態會提示您一個設定提示,您可以將其貼到您的編碼代理中:
```
I want to add product analytics to this project. Read the current directory and use the InsForge skill to set up PostHog analytics by running `npx @insforge/cli posthog setup`.
```
`@insforge/cli posthog setup` 將您的 InsForge 專案連結到 PostHog,然後列印官方 [PostHog 嚮導](https://posthog.com/docs/libraries/wizard) 命令 (`npx -y @posthog/wizard@latest`) 供您(或您的代理)接下來執行。嚮導檢測您的框架,安裝正確的 PostHog SDK,並放入初始化程式碼,以便頁面瀏覽、自動擷取事件和工作階段錄製開始流動。
### 流量
您選定的時間範圍內的 KPI(訪客、頁面瀏覽、工作階段、跳出率和趨勢),加上按頁面、國家和裝置類型的細分。對於第一次"本週應用程式的表現如何"的檢查而無需打開 PostHog 很有用。
### 使用者保留
從您的 PostHog 事件建構的隊列保留圖表。選擇一個時間範圍,看看有多少使用者在隨後的幾天或幾週內回來。
### 工作階段回放
最近工作階段錄製的分頁清單,包含持續時間、個人和深入連結到 PostHog 的完整回放播放器。當在流量或保留中發現異常後,可幫助您觀察使用者實際做了什麼。
### 設定和中斷連接
分析設定對話(側邊欄中的齒輪圖示)讓管理員審查連結的 PostHog 專案,直接跳轉到 PostHog,並在需要時中斷連接。中斷連接只會中斷 InsForge ↔ PostHog 連結;您的 PostHog 專案、事件和錄製保持不變。
## 概念
分析頁面後面的事件、自動擷取、見解和儀表板。
錄製如何被擷取、編輯和回放。
## 使用它進行建置
自動檢測您的框架,安裝正確的 PostHog SDK,並新增初始化程式碼。
在嚮導設定的基礎上擷取自訂事件。
`npx @insforge/cli posthog setup` 將您的 InsForge 專案連結到 PostHog,然後列印嚮導命令。
## 下一步
* 在儀表板中開啟分析頁面,點擊 **連接 PostHog**。
* 將設定提示貼到您的編碼代理中,然後執行它列印的 `@posthog/wizard` 命令,將 SDK 連接到您的應用程式。
* 如果您想從終端管理連接,設定 [CLI](/quickstart)。