

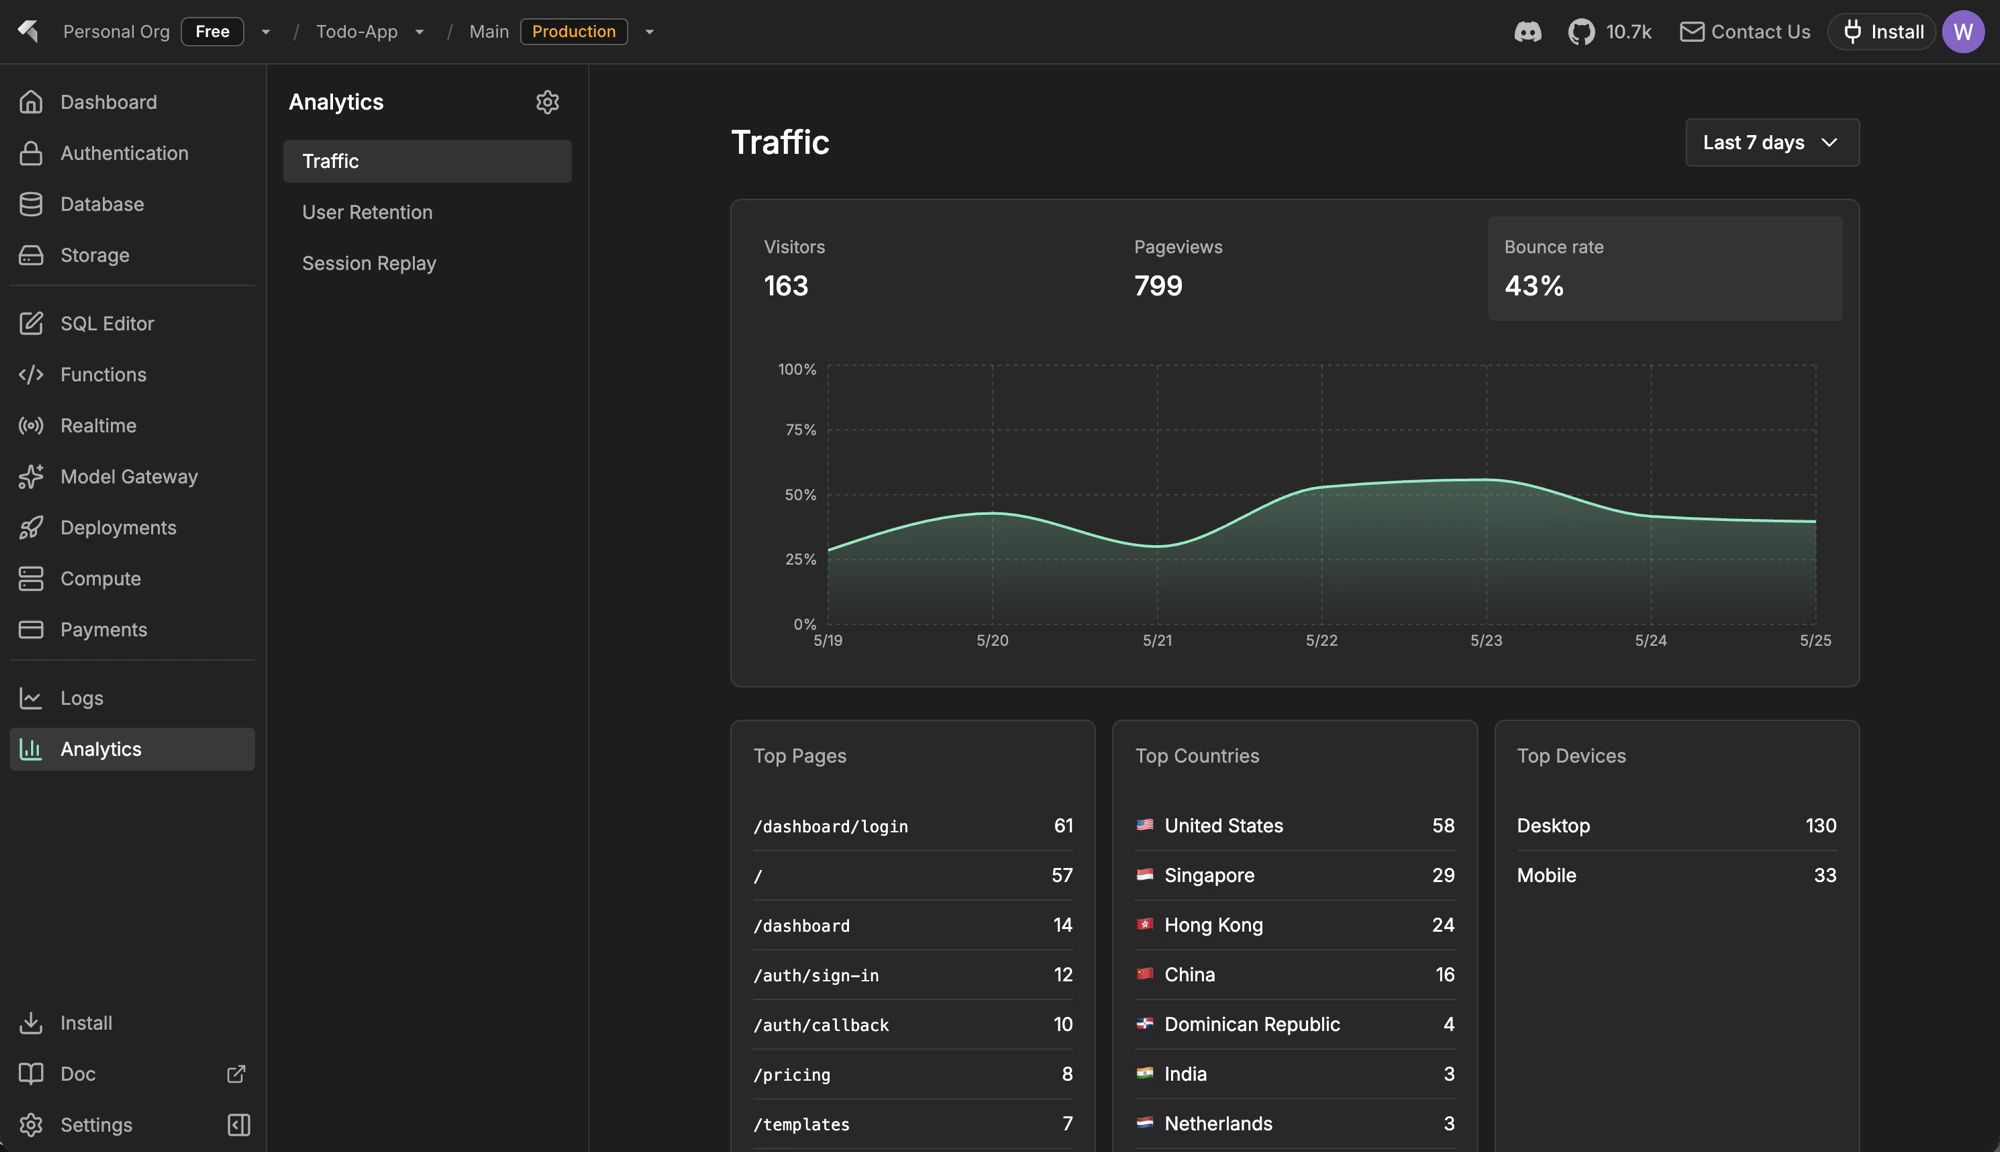
Analytics dashboard: KPIs over time plus breakdowns by page, country, and device.
PostHog remains the source of truth for events, dashboards, insights, and recordings. InsForge surfaces a focused subset for everyday checks, then deep-links into PostHog for anything beyond it.
Features
One-click PostHog connection
Connect PostHog from the Analytics page in the dashboard. InsForge provisions or links a PostHog project for you, stores credentials server-side, and unlocks the Traffic, Retention, and Session Replay pages once the connection succeeds.SDK setup via PostHog wizard
After connecting, the empty state ships a setup prompt you can paste into your coding agent:@insforge/cli posthog setup links your InsForge project to PostHog, then prints the official PostHog wizard command (npx -y @posthog/wizard@latest) for you (or your agent) to run next. The wizard detects your framework, installs the right PostHog SDK, and drops in initialization code so pageviews, autocapture events, and session recordings start flowing.
Traffic
KPIs over your selected time range (visitors, pageviews, sessions, bounce rate, and trend), plus breakdowns by Page, Country, and Device Type. Useful for the first “how is the app doing this week” pass without opening PostHog.User retention
Cohort retention chart built from your PostHog events. Pick a time range and see how many users come back over the following days or weeks.Session replay
A paginated list of recent session recordings with duration, person, and a deep-link into PostHog’s full replay player. Helps you watch what users actually did right after spotting something odd in Traffic or Retention.Settings and disconnect
The Analytics Config dialog (the gear icon in the sidebar) lets admins review the linked PostHog project, jump straight into PostHog, and disconnect when needed. Disconnecting only severs the InsForge ↔ PostHog link; your PostHog project, events, and recordings stay intact.Concepts
PostHog product analytics
Events, autocapture, insights, and dashboards behind the Analytics pages.
PostHog session replay
How recordings are captured, redacted, and played back.
Build with it
PostHog wizard
Auto-detects your framework, installs the right PostHog SDK, and adds initialization code.
PostHog JavaScript SDK
Capture custom events on top of what the wizard sets up.
InsForge CLI
npx @insforge/cli posthog setup links your InsForge project to PostHog, then prints the wizard command.Next steps
- Open the Analytics page in the dashboard and click Connect PostHog.
- Paste the setup prompt into your coding agent, then run the
@posthog/wizardcommand it prints to wire the SDK into your app. - Set up the CLI if you want to manage the connection from the terminal.